Power BI Desktop: The Tool for Creating Dynamic Business Reports
By VALUE4YOU
Published On April 19, 2023
of Luca Vanzulli
by Luca Vanzulli Blogger, Planning & Control Specialist, Content Marketer
In a competitive arena that is increasingly uncertain and influenced by technological innovation, brands are increasingly aware of the importance of seeking business advantages and opportunities through the identification of data analysis strategies. This modus operandi leads to a continuous search for tools and instruments that can assist in the aggregation, processing and synthesis of huge amounts of data. The speed and simplification of analysis processes are key elements in fostering decision making focused on finding a competitive advantage. With this in mind, it may be interesting for companies to explore the potential of Power BI desktop, which can be downloaded free of charge from the Microsoft website.
Change of a mindset
For those who are used to using the classic spreadsheet initially will have to work hard on changing their approach. In fact, excel while being the most widely used application in the world for data analysis due to its versatility and reliability, nevertheless has operational limitations, which emerge especially when dealing with massive data that feed over time and perhaps come from multiple sources of origin. Initially, the transition from Excel to PowerBI, might create some discouraging moments, as one has to change the approach of viewing the data and its structure.
The cell is no longer the reference point. Progressively, a new way of importing, updating, aggregating, processing and synthesizing data will open up to you. Who knows how many times it will have happened to you too that you have created static models with excel, which after some time you had to recreate in order to import new information or new reports. Power BI can indeed be a very powerful and versatile platform, which, thanks to its countless features that are constantly being updated, can help create added value. However, these considerations do not urge you to abandon excel, which indeed for certain types of analysis is still absolutely to be used, but rather to add new tools in your daily operations.
Power BI Desktop: why you need it and how it works
Power BI Desktop can be defined in all respects as a platform of self business intelligence: through a mechanism of very intuitive logical steps, the user is able to create interactive and dynamic reports and dashboards. The tool is definitely flexible, scalable and allows very good granularity of data.
Power BI Desktop works through the combination of data, which may come from different sources; the aggregation of information using queries and the creation of a real data modeling process represent a stimulating added value after becoming familiar with the environment.
The tool can be a really valuable analysis support for:
- creation of data synthesis through an effective strategy of data visualization;
- advanced use of relational tables for combining data;
- the customization of calculated columns;
- use of advanced filters;
- programming of more structured and complex formulas obtainable through DAX - Data Analysis Expressions.
Power BI Desktop: who can benefit from it
Business analysts, CFOs, controllers, business managers, marketers, management consultants, accountants, and all those who work with data on a daily basis are the professionals who can benefit through the use of PowerBI's capabilities.
Power BI Desktop: three essential pillars of data analysis
Power BI Desktop in fact combines several technologies, which have been implemented over time; we refer, for example, to three pillars of Microsoft's house:
- the query system;
- the approach of data modeling;
- the concept of interactive visualization of business information.
Loading data from even different sources into a single work environment can allow different levels of granularity to be defined.
Therefore, it will also be possible to create custom queries and connections of data from different sources.
Power BI Desktop and data-driven corporate culture
The reports created and customized can be easily shared and reviewed with other users. Its intuitiveness for preparing dynamic reports can give impetus to the spread of a corporate culture oriented toward the centrality of data and its processing and aggregation, bringing enormous value to management control activities. Using a tool such as PowerBI facilitates the creation of dynamic and interactive reporting by combining tables and text boxes with visual elements such as maps, matrices and charts.
What is the final output?
The final output will be obtainable with high customization due to the variety of options made available by the tool. The data modeling will lead you to create structured, dynamic, interactive reports with enormous opportunity for temporal combination of the variables involved. Think, for example, of revenue trend comparisons at the macro level and subsequent drilldown by products and subproducts. Imagine, for example, making sales undashboards: every month with a one-click update you can quickly feed your summary report by uploading monthly data.
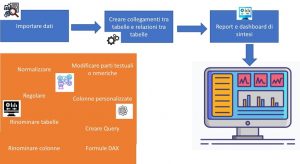
However, it is a good idea to spend some time figuring out how to relate the various data tables before focusing on data visualization. Study how to aggregate your database, through a data cleaning phase and a phase of structuring the information you want to synthesize. Always think with a view to continuous updates of your information.
Do you want to know more? Learn more about Power BI training courses offered by Value4You!
How to make the download of the free version
The PowerBI Desktop version can be downloaded for free for personal use at the following link: https://powerbi.microsoft.com/it-it/downloads/.